If you’ve been wondering how to learn Power BI in 2025, you’re in the right place. Whether you’re aiming to land a data analyst job, boost your resume, or even start freelancing, BI skill you simply can’t ignore anymore. With companies going all-in on data-driven decisions, learning Power BI could be the smartest career move you make this year.
In this guide, I’ll walk you through the complete roadmap—from what Power BI is, to the exact steps to learn it, to how to actually build projects and find jobs. If you’re serious about making sense of data and visualizing insights like a pro, stick around.
In today’s competitive job market, simply having a degree isn’t enough. Employers are actively seeking candidates with practical skills that drive business results, and Power BI tops that list in the world of business intelligence. Whether you’re a student trying to enhance your employability, a working professional planning a career switch, or an entrepreneur wanting to understand your business metrics better, Power BI equips you with the superpower to interpret and present data in a way that influences decisions.
Plus, the best part? You don’t need to be a tech genius. With the right guidance and practice, anyone can learn Power BI and start creating stunning dashboards. Let’s dive in.
What is Power BI and Why Should You Learn It?
If you’re someone who’s ever struggled to make sense of messy spreadsheets or wanted to create reports that tell a story, Power BI is your new best friend.
At its core, Power BI is a powerful data visualization and business intelligence tool by Microsoft. It helps you take raw data from multiple sources, clean it up, model it, and turn it into visually appealing dashboards and reports. Think of it like Excel’s smarter, more intuitive cousin—only 10x more powerful when it comes to making data-driven decisions.
So, why should you learn Power BI? Well, whether you’re in marketing, sales, HR, finance, or even a student, it’s becoming a must-have skill. Companies everywhere are looking for people who can turn data into insights. Power BI lets you do exactly that, without needing a hardcore coding background. It’s intuitive, flexible, and in demand. Plus, once you start creating your dashboards, it’s honestly addictive.
Let’s start simple. Power BI is a business intelligence tool by Microsoft that helps you transform raw data into meaningful dashboards, charts, and visuals. Think of it like Excel on steroids.
It’s used by analysts, managers, marketers, and even small business owners to understand data and make better decisions. Companies across various industries, including finance, healthcare, e-commerce, and IT, are hiring Power BI professionals.
Learning Power BI is more than just a tech skill. It’s a gateway to data literacy, storytelling, and career growth.
Whether you’re a marketer, sales analyst, or finance executive, you can use Power BI to drive results.
You don’t need coding to learn Power BI from scratch — its drag-and-drop interface is intuitive and beginner-friendly
Career Benefits of Learning Power BI
Learning Power BI doesn’t just make you technically skilled—it makes you professionally valuable. In a world overflowing with data, businesses need people who can cut through the noise and find what truly matters. That’s where Power BI professionals come in.
From small startups to Fortune 500 companies, employers are actively hiring individuals who can convert rows of data into actionable insights. And it’s not limited to just IT or tech teams—Power BI roles exist across marketing, operations, logistics, finance, and even HR.
Freelancers and consultants are also cashing in. Many businesses can’t afford full-time data analysts, so they look for project-based experts to build dashboards or generate reports. If you’re a freelancer, mastering Power BI opens up a stream of high-paying gigs.
Power BI skills also complement other tools. If you know Excel, SQL, Python, or even Tableau, Power BI adds a new dimension to your skill set, increasing your versatility and chances of promotion. In short, it’s not just a skill—it’s a career accelerator.
Here’s the exciting part: BI isn’t just a “good-to-have” anymore. It’s a “must-have.”
- In-demand roles: Business Intelligence Analyst, Data Analyst, Power BI Developer, Dashboard Designer
- Salary expectations: Entry-level roles can start at INR 5-8 LPA in India; globally, it’s even more.
- Freelance gigs: Many companies hire BI tool experts for short-term projects. You could easily land a remote job.
What You Need to Get Started
Don’t worry you don’t need a tech degree. But a few basics will help:
Technical:
- Comfortable using a computer
- Some knowledge of Excel (VLOOKUPs, Pivot Tables)
- SQL basics (not a must, but very helpful)
Business:
- Understanding of KPIs, metrics, and business goals
- Love for solving problems and making sense of chaos
That’s it. You don’t need to know coding or advanced mathematics. Many Power BI learners come from non-technical backgrounds, such as marketing, HR, or sales. If you’ve ever worked with reports, dealt with spreadsheets, or asked questions like “What’s driving our numbers?”—you’re already halfway there. The learning curve is smooth if you stay consistent and start building real dashboards from the very beginning.
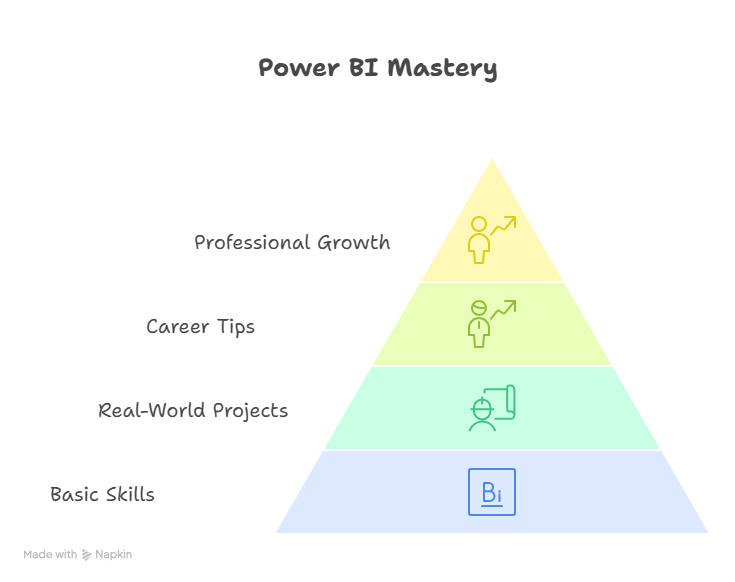
How to Learn BI Tools: The 4-Phase Roadmap
Let’s face it—learning anything new can feel overwhelming at first, especially something that involves data and tech. But don’t worry. I’ve broken the learning process down into four easy-to-follow phases so that you never feel stuck or lost. Whether you’re studying part-time, working a full-time job, or juggling both, this roadmap is designed to work with your schedule.
Phase 1: Getting Started (Weeks 1–2)
This is your foundation. At this stage, your goal is to get comfortable with the tool. Don’t rush.
- Download and install Power BI Desktop (it’s free).
- Open it up and start exploring the interface: what’s in the ribbon, where to find charts, and how to access data.
- Try importing sample data from Excel or CSV files.
- Learn how to navigate the fields pane, visualizations pane, and report canvas.
- Create your first visual—a bar chart, pie chart, or card KPI.
- Use Power Query Editor to do basic data cleaning, like removing blank rows or renaming columns.
It’s okay if it feels a little messy. The goal is to just start experimenting and getting familiar.
Phase 2: Core Concepts (Weeks 3–6)
Once you’re confident using the interface, it’s time to understand the heart of Power BI: data modeling and DAX.
- Learn how to structure your dataset with relationships between tables (this is where a little database understanding helps).
- Create calculated columns and measures to extract insights.
- Dive into basic DAX (Data Analysis Expressions)—think of it like formulas in Excel, but more powerful.
- Build dashboards with multiple visuals and interactive filters (slicers).
- Experiment with various visual types, such as matrix tables, line charts, gauges, and maps.
By the end of this phase, you should be able to build a functional, insight-driven report with connected data and clear storytelling.
Phase 3: Intermediate Skills (Weeks 7–10)
This is where things get exciting! You’ll begin to level up with more advanced capabilities:
- Explore advanced DAX functions for dynamic calculations like time intelligence (YTD, MTD, QoQ).
- Use Power Query for more complex transformations like merging, appending, pivoting, and unpivoting data.
- Build fully interactive dashboards using bookmarks, drill-throughs, and dynamic filters.
- Learn how to create hierarchies (e.g., Year > Month > Day) and apply conditional formatting.
- Publish your reports to Power BI Service and share them with others.
At this point, you’ll feel more confident solving business problems with data and presenting your findings effectively.
Phase 4: Advanced Techniques (Weeks 11–16)
Now it’s time to think like a pro. If you’re aiming for freelance work, a full-time job, or Power BI certification, this phase is where you’ll stand out.
- Implement Row-Level Security (RLS) so that different users see different data.
- Use custom visuals from the Microsoft Marketplace to enhance your dashboards.
- Integrate Power BI with other tools like Excel, Teams, or SharePoint.
- Practice performance tuning—optimize large datasets, improve load times, reduce memory usage.
- Try out AI features like Key Influencers, Forecasting, and Smart Narratives.
Once you’ve mastered these, you’re no longer just learning Power BI—you’re using it like a true business intelligence analyst.
Best Resources to Learn Power BI in 2025
Free Resources
- YouTube: Guy in a Cube, Leila Gharani, SQLBI
- Microsoft Learn
- Kaggle, data. world or makeover Monday for practice datasets
- Reddit r/PowerBI, Power BI Community, and LinkedIn groups.
Paid Resources
- Tutedude Power BI course (top-rated for beginners)
- Bootcamps or live classes
- Mentorship programs, if you need accountability.
Should You Get Certified?
Now, the big question: Should you invest time and money into getting Power BI certified? If you’re learning Power BI to land a job, switching careers, or even freelancing professionally, the answer is yes—absolutely.
Microsoft’s official certification for Power BI is called the PL-300: Power BI Data Analyst Associate. It validates your skills in data preparation, modeling, visualization, and deployment. Having this badge on your resume or LinkedIn profile shows employers that you’re not just self-taught—you’ve mastered the core concepts and passed a globally recognized exam.
But even beyond the job market, preparing for the PL-300 exam gives you structure. It ensures you’re covering all the important areas—like DAX, data modeling, Power Query, and security. And let’s be honest: having a clear goal (like certification) helps keep you focused and motivated.
Plus, it opens doors to higher-level roles. Certified professionals often earn more and are trusted with more responsibility.
That said, certification isn’t mandatory. If you’re already getting freelance clients or have a killer portfolio, you’re doing great. But if you want that extra edge, go for it—it’s worth every bit of effort.
Build Your First Power BI Project
Don’t wait till you’re “ready.” Start building early. Here’s how:
- Choose a dataset: Something simple like sales, student grades, or survey data
- Define a business question: e.g., “Which region is underperforming in sales?”
- Design your layout: Plan your dashboard on paper
- Clean and model the data
- Build visuals: Charts, KPIs, filters
- Add interactivity and publish your report
Pick a project that solves a real problem or tells a clear story—it could be about school performance, product reviews, or social media trends. The more relatable, the better. Try showcasing it on LinkedIn or your portfolio for instant credibility. Employers and clients love real-world applications.
Common Challenges (and How to Beat Them)
- Stuck on DAX formulas? Use the official documentation + forums
- Overwhelmed by visuals? Stick to clean, simple charts first
- Low performance? Optimize by removing unnecessary columns
- Not sure what to build? Copy dashboards from YouTube and tweak them
- Feeling unmotivated? Set mini-goals, celebrate small wins, and join a learning community to stay accountable
- Facing errors? Don’t panic—read the error, Google it, or ask on forums. Everyone struggles in the beginning.
- Lack of practice data? Use free datasets from Kaggle or Power BI samples
Remember, consistency is key. You don’t have to be perfect—you just have to keep going.
Tips to Speed Up Your Power BI Learning
- Set weekly goals (e.g., “Finish 3 lessons + 1 mini project”)
- Practice with real data—not just theory
- Join Power BI communities for feedback
- Watch update videos monthly (Power BI gets new features every month!)
- Follow creators on LinkedIn and replicate their dashboards
- Document your progress—it builds confidence and makes learning sticky
- Try teaching a concept to someone else—it’s the best way to reinforce it
Learning Power BI is like going to the gym: results come with consistency, not perfection. And please, don’t skip data modeling. It’s the heart of good BI work.
Career Paths After Learning Power BI
Once you’re confident, here’s where you can go:
- BI Analyst
- Power BI Developer
- Dashboard Consultant (freelance!)
- Data Analyst
You can also branch into data storytelling, consulting, or even become a Power BI trainer. As businesses continue to prioritize data, your role will only grow in demand. Start applying on LinkedIn, Upwork, and niche analytics job boards. Build your personal brand through portfolio projects and content creation. Join discussions. Post your dashboards.
Staying Updated in 2025 and Beyond
- Follow the Microsoft Power BI Blog
- Subscribe to newsletters like DataChant or SQLBI Weekly
- Join monthly Power BI community calls or webinars
- Participate in challenges like Makeover Monday
- Follow influencers on LinkedIn and YouTube
- Attend virtual or local Power BI meetups
- Try out preview features in Power BI Desktop for an early hands-on experience
Power BI evolves fast—make a habit of staying plugged in. Even 15 minutes a week keeps you ahead of the curve.
Continuous learning is the secret sauce. Don’t stop after your first project.
Final Thoughts: Your First Step Starts Now
Learning Power BI in 2025 isn’t as hard as it seems. All you need is the right roadmap, a little patience, and the willingness to get your hands dirty with data.
Start today. Download Power BI Desktop. Connect a dataset. Create your first chart. It’s okay if it’s messy—you’re learning.
Every expert once started with confusion and curiosity. What matters is taking that first step. The more you build, the more confident you’ll become. And before you know it, you’ll be answering data questions like a pro.
And if you’re serious, go check out Tutedude’s Power BI course. It’s beginner-friendly and super practical.
The data world is calling. Are you ready?

