

Introduction
Paginated Reports in Power BI are a powerful feature that enables the creation of clean, printable, and data-rich documents tailored for reporting needs. While Power BI is widely known for its interactive dashboards and modern data visualizations, it also excels at producing paginated reports — ideal for generating invoices, financial statements, and formal business documents. Unlike interactive reports focused on data exploration, paginated reports maintain a traditional, structured layout suitable for export and printing.
What Are Power BI Paginated Reports?
Power BI’s significant components are:
- A Windows desktop application, Power BI Desktop, allows users to create rich and interactive dashboards that help them explore and visualize data.
- An online software as a service (SaaS) called the Power BI service.
- Power BI Mobile apps for Windows, iOS, and Android devices.
- Power BI Report Builder: This free, standalone Microsoft tool generates paginated reports that can be uploaded to the cloud using Power BI services.
- Power BI Report Server: This is present on the local server to upload and share Power BI reports locally, not in the cloud.
Paginated reports are like traditional-style reports in a document with a clean, structured layout across the page. When data is extensive, the content is automatically arranged to fit on each page, thus termed as paginated perfectly. If data stretches to multiple pages, it formats the data to fit the other page with proper layout and print-ready output so that they can be exported as a PDF file, Word, or Excel document. They are commonly used to generate invoices, financial statements, medical reports, and summaries to cater to the business needs.
Power BI Report Builder is the tool that generates paginated reports.
On the other hand, the Power BI Desktop is a Windows desktop application that can pull data from multiple sources by connecting to them, transform and clean the data using Power Query, and then build interactive dashboards and reports using visuals like charts, tables, and maps.
Key Features of Power BI Paginated Reports include:
Multi-Page Layout
Think you have a long invoice, bill, or salary slip? Instead of accommodating all the data in one big scrollable page like a dashboard, a multi-page layout breaks it into neat print-friendly pages, one after the other, just like a book document. Each page is adequately sized with proper headers, footers, and a structured layout to look neat on screen or in printouts.
Advanced Table Formatting
This makes your table look precisely how you want it to, just like in formal documents or printed reports. It involves precise control over layout, like setting exact dimensions, spacing, and text alignment. You can change color, font, or background based on data with conditional formatting.
Export Options
It provides a variety of file formats and methods for saving, downloading, and sharing, like PDF, Excel, Word, CSV, XML, and MHTM.L
Parameter-Based Filtering
It allows users to customize the data in their reports by taking input values called parameters even before the report is generated. E.g., “Show me sales from October to December.”
Automated Report Delivery
This feature helps schedule emails or automatically generate reports, saving time.
When to Use Power BI Paginated Reports
Paginated reports are used to cater to the following needs:
Enterprise Reporting Needs
Large organizations have specific reporting requirements for handling large volumes of data with accuracy, consistency, and security while maintaining standardized formats. These reports are shared with different departments, clients, and other stakeholders.
Regulatory and Compliance Reporting
They are mandatory for meeting the rules and standards set by governments, industry, and audit teams, such as tax filing and safety compliance reports. Power BI Paginated Reports ensure standards are followed to meet regulatory needs.
Internal Operations
Power BI Paginated Reports helps manage these daily operations by generating reports such as daily sales trackers and attendance reports.
Client-Facing Outputs
These reports are sent directly to the client and thus need to be professional, accurate, and well-formatted, such as bills and invoices, project status, performance reports, etc.
How to Create Power BI Paginated Reports
1. Prerequisites
Before creating Power BI Paginated Reports, you’ll need a few things ready:
Download and install Power BI Report Builder, a free Windows desktop tool for creating paginated reports. You can also learn about data, like how it’s structured, how to create datasets and connect to different data sources, and concepts about reporting. If you want to publish your reports to the cloud, you’ll need a Power BI Pro or Premium license to share them using the Power BI Service.
2. Connect Data Sources
Data can come from multiple sources. Power BI paginated reports support data sources. To connect to the data sources, open Power BI Report Builder, click on “Data Source,” select the type you want to connect to, and enter connection details like server name or file path.
Learn how to streamline data ingestion and transformation using Power BI Dataflows
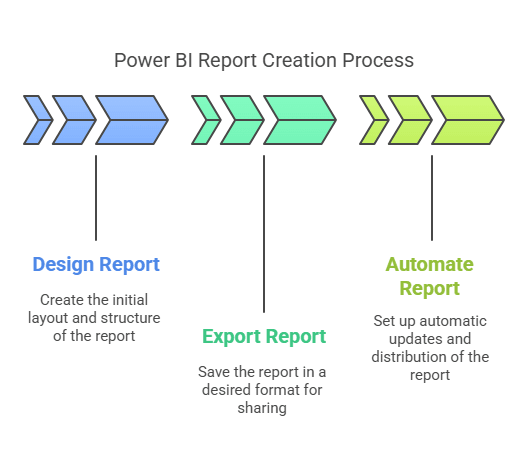
3. Design the Report
Power BI Report Builder’s drag-and-drop interface makes it easier to build reports. It allows you to add tables, charts, and text boxes, set page layouts, like margins, dimensions, and page breaks, and arrange the data neatly, giving a professional look.
4. Apply Filters and Parameters
Filters help the viewer choose only the data they want to see before exporting the report, while parameters make the report more flexible.
5. Preview and Publish
Upon clicking run in the Report Builder, it previews the report. You can check details like margins, formatting, and data, and then publish it.
Exporting and Sharing Paginated Reports
Export Formats
Once published, you can export the report informats like PDF, Excel, Word, CSV, and XML.
Scheduling and Automation
You can send reports automatically daily, weekly, or monthly based on frequency. This feature is available in Power BI premium. It also allows you to add reports directly to the body of an email rather than sending them as an attachment.
Sharing and Embedding
You can also embed paginated reports directly inside other applications. For example, you can directly add the report to CRM, so the user doesn’t need to open Power BI separately. Power BI Service also grants access control to paginated reports, such as who can view and interact with reports, thus securely sharing the reports.
Best Practices for Optimizing Paginated Reports
Performance Tips
Applying filters like date range, product category, region, etc., reduces retrieved data volume, report generation speed, and rendering time. When multiple datasets pull the data for one report, Power BI has to connect different data sources, using more memory and processing power. You can combine or consolidate your data into fewer sources and reuse existing data sets that already contain the data.
Consistent Design
The entire report should look uniform across different pages; this can be done by using standard fonts, colors, and headers. Reports should align with your company’s brand identity. The company’s logo, colors, and style guidelines should be consistent on all pages and in all reports.
Data Validation
Data validation ensures that the data is correct and accurate. You should check that calculations, conditions, and filters are correctly applied to draw error-free and meaningful conclusions.
Structure for Readability
Reports should be easy to read and understand. Headers, page numbers, and summaries help readers navigate the report easily. Bold titles and consistent spacing make the layout clean and improve the overall flow for readers.
Challenges and Limitations
Power BI paginated reports are a powerful tool for generating reports, but they also have some limitations:
Interactivity Constraints:
Unlike dashboards, reports lack dynamic interactivity, have no real-time filtering, and don’t change in real time. The visuals are static; you cannot drill down or use slicers for live filtering. They are designed primarily for export and printing.
Performance Concerns
Extensive reports containing complex data take longer to load and export. Minimizing unnecessary data, consolidating data sources, and optimizing queries improve performance.
Compatibility Issues
You require Power BI Premium, a high-tier subscription to the Power BI service, to publish and schedule paginated reports. A separate tool, Power BI Report Builder, also creates paginated reports.
Conclusion
Power BI paginated reports are a very influential tool for detailed, printable, and exportable reports. Though they differ from interactive dashboards, they are essential tools for enterprise-level reporting, legal compliance, and client-facing documents. Though they have some challenges, with proper planning and optimizing techniques, you can enhance an organization’s reporting capabilities and deliver data in a professional format.
Call to Action (CTA)
Do you wish to become a pro in Power BI and create dashboards and reports confidently? Enroll in a Power BI course on Tutedude today!
Found this article helpful? Bookmark it, share it with your team, or drop us a comment below!


