


Introduction
Data analysis with Python has become an essential skill for professionals across various industries. By using Python’s powerful libraries like Pandas, data analysis has never been easier and more efficient. Whether you’re handling big data, performing scientific research, or working with business datasets, Python provides the tools to manage and analyze data effectively.
The demand for highly skilled professionals who can play with data, understand complex mathematical strategies by analysing complex datasets has increased abruptly. Python has become a top choice for data analysis due to its efficiency, clear syntax, and rich library ecosystem. Python and libraries like Pandas, Matplotlib, pyplot, numpy, and seaborn are widely used for data analysis. It provides structured data and features for efficient data manipulation, cleaning, and analysis.
What is Pandas in Data Analysis?
Pandas is a renowned library for data analysis in Python. It allows flexible data manipulation and analysis through two primary data structures: Series (1D) and DataFrame (2D). The series is one-dimensional, whereas the Data Frame is two-dimensional. These structures allow users to organize, label, and manage data. We can analyze any numerical or textual data extracted from any source, such as CSV files, SQL databases, or Excel spreadsheets. Pandas can perform various data-related operations, including:
- Fast loading, efficient cleaning, and transformation of large datasets
- Excellent alignment and indexing that allows clear organisation and easy access to data
- Handling of missing and null values to increase data quality
- Flexibility for the reshaping and merging of datasets for in-depth analysis
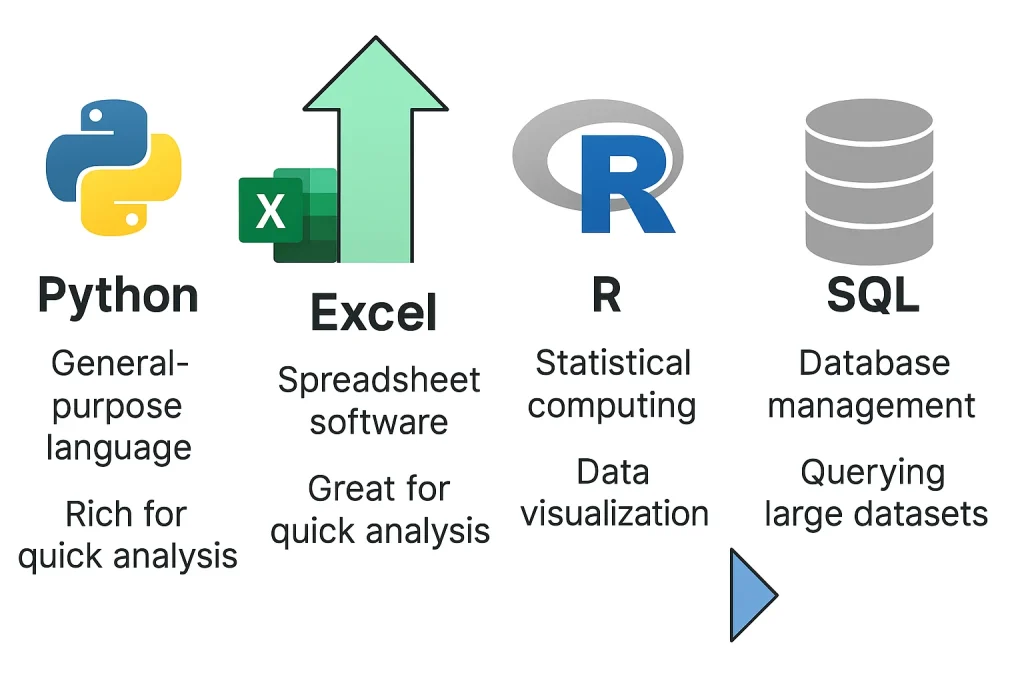
Python vs Excel vs R vs SQL: Which One’s Better for Data Analysis?
- Excel is a user-friendly tool for analysing small datasets. It has special built-in features like Pivot Tables and charts for visual representation of data. But for large datasets consisting of more than 10,000 rows, we need efficient tools like Python with libraries like pandas and seaborn that can handle millions of rows easily.
- R is a powerful tool commonly used for statistical analysis. Apart from analysis, it can perform various other tasks, including modelling, clustering, and Time-series modelling, and can also handle large datasets. However, Python with pandas is more versatile and integrates seamlessly with machine Learning workflows.
- SQL is used for querying, filtering, and aggregating datasets. It is widely used in industry and is highly efficient for extracting and joining large datasets. However, SQL is limited to data retrieval and transformation. For advanced analysis, Pandas offers great flexibility and a set of analytical tools with Python scripts.
While Excel is great for small-scale analysis and SQL excels at querying large databases, Python with Pandas combines power, flexibility, and scalability — making it a top choice for end-to-end data analysis and automation.
Installing and Importing Pandas for Data Analysis with Python
Installing Pandas:
Using pip:
pip install pandas
Using conda:
conda install pandas
How to import Pandas in a script or notebook:
import pandas as pd
To check if Pandas is installed properly:
print(pd.__version__)
Insights about Pandas Data Structures
Series
A dimensional labelled array that can hold any type of data can hold integers, floats, strings, or even Python objects. Each value has its index label that helps in accessing and manipulating easy and efficient.
Example:
import pandas as pd
# Creating a Series from a list
data = [10, 20, 30, 40]
series = pd.Series(data, index=['a', 'b', 'c', 'd'])
print(series)
Output:
a    10
b    20
c    30
d    40
dtype: int64
DataFrame
Two-dimensional labelled data structure that helps to organise information into rows and columns.
From a List of Lists
import pandas as pd

data = [
    [1, 'Alice', 85],
    [2, 'Bob', 90],
    [3, 'Charlie', 78]
]
df = pd.DataFrame(data, columns=['ID', 'Name', 'Score'])
print(df)
From a Dictionary
data = {
    'ID': [1, 2, 3],
    'Name': ['Alice', 'Bob', 'Charlie'],
    'Score': [85, 90, 78]
}
df = pd.DataFrame(data)
print(df)
From a NumPy Array
import numpy as np

array_data = np.array([
    [1, 85],
    [2, 90],
    [3, 78]
])
df = pd.DataFrame(array_data, columns=['ID', 'Score'])
print(df)
From a CSV File
Assuming students.csv:
ID,Name,Score 1,Alice,85 2,Bob,90 3,Charlie,78df = pd.read_csv('students.csv') print(df)
Importing and Exporting Data
How to read data:
- CSV:
pd.read_csv('file.csv') - Excel:
pd.read_excel('file.xlsx') - JSON:
pd.read_json('file.json')
Writing data:
- CSV:
df.to_csv('output.csv') - Excel:
df.to_excel('output.xlsx') - JSON:
df.to_json('output.json')
Solution to common file path error:
- Double-check the file path and extension.
- Use raw strings (prefix with
r) for Windows paths. - Ensure you have read/write permissions.
Exploring Data and Summary Stats
print(df.head())
print(df.info())
print(df.describe())
head()– Shows the first 5 rowstail()– Shows the last 5 rowssample()– Returns a random sampleinfo()– Displays DataFrame summarydescribe()– Summary statistics
Cleaning Data in Pandas
Handling missing values:
df.isnull()
df.dropna()
df.fillna(value)
Dropping duplicates:
df.drop_duplicates()
Converting data types:
df['col'] = df['col'].astype(int)
Parsing dates and categoricals:
pd.to_datetime(df['date_col'])
df['col'] = df['col'].astype('category')
Selecting and Filtering Data
loc[] – Label-based:
df.loc[2, 'Name']
df.loc[df['Age'] > 25]
iloc[] – Position-based:
df.iloc[0, 1]
df.iloc[0:3, :]
Slicing:
df['Name']
df[['Name', 'Age']]
Transforming Data
- Sorting:
df.sort_values('column'),df.sort_index() - Renaming:
df.rename(columns={'old': 'new'}) - Applying functions:
df['col'].apply(func),df['col'].map(dict) - Reshaping:
df.melt(),df.pivot(),df.transpose()
Grouping and Aggregating
df.groupby('column').mean()
df.groupby(['col1', 'col2']).sum()
df.agg({'col1': 'mean', 'col2': 'sum'})
Merging and Joining DataFrames
pd.concat([df1, df2])
pd.merge(df1, df2, on='key')
df1.join(df2, how='left')
Join types: inner, outer, left, right
Visualizing Results in Data Analysis with Pandas
df.plot.line()
df.plot.bar()
df.plot.hist()
df.plot.box()
Customization:
- Add titles, axis labels, and legends
- For advanced plots, use Matplotlib or Seaborn
import matplotlib.pyplot as plt
plt.savefig('plot.png')
Hands-On Example: Analyzing a Public Dataset
Step 1: Load Data
import pandas as pd

df = pd.read_csv('World Happiness Report 2021.csv')
Step 2: Explore Data
print(df.head())
print(df.info())
print(df.describe())
Step 3: Clean Data
df['Score'].fillna(df['Score'].median(), inplace=True)
df.drop_duplicates(inplace=True)
Step 4: Analyze and Visualize
# Average happiness score by region
avg_score = df.groupby('Regional indicator')['Score'].mean()
print(avg_score)

# Plot average score by region
avg_score.plot(kind='bar', title='Average Happiness Score by Region')

import matplotlib.pyplot as plt
plt.ylabel('Score')
plt.show()
Step 5: Summarize Insights
- Some regions consistently report higher happiness scores.
- Visualizations reveal disparities and trends across regions.
Common Mistakes and Best Practices in Pandas
SettingWithCopyWarning
# Problematic
df_subset = df[df['age'] > 30]
df_subset['eligible'] = True

# Correct
df.loc[df['age'] > 30, 'eligible'] = True
Tips:
- Avoid modifying raw data directly
- Chain pandas methods for step-by-step clarity
- Use chunks for large datasets
- Comment code and use descriptive variables
- Maintain reproducibility and collaboration clarity
Conclusion
Pandas act as essential resources for data analysis. They empower users to effectively manage, clean, and analyse real-world datasets. To become proficient in Python and Pandas, practice working with real-world datasets like those from Kaggle or open government portals. This will solidify your skills and prepare you for advanced topics such as time series analysis, predictive modeling, and machine learning workflows. With more practice, one can easily jump to more advanced topics like Time series and advanced data visualisation or combine Pandas with machine learning workflows.


