Don't just learn... Master it!
Join our Community Now
- Data
- Development
- Design
- Career
- Artificial Inteligence
- Business
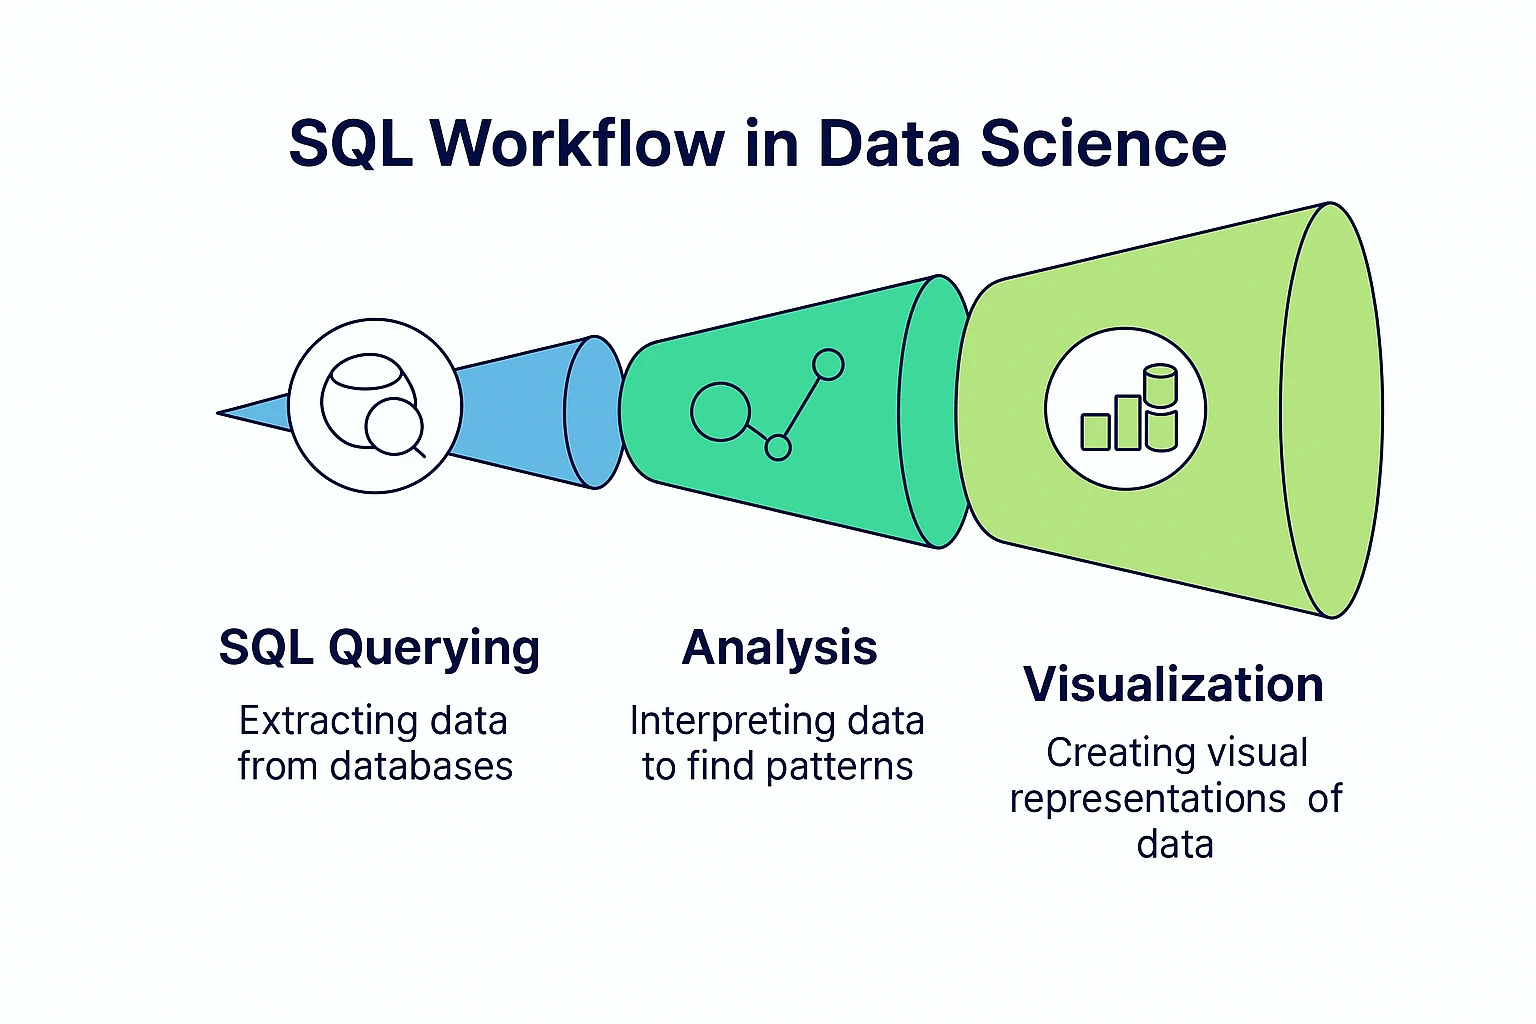
Top SQL Queries Every Data Scientist Should Know
Learn the essential SQL queries for data scientists to filter, join, group, and analyze data efficiently for better insights and faster decisions.
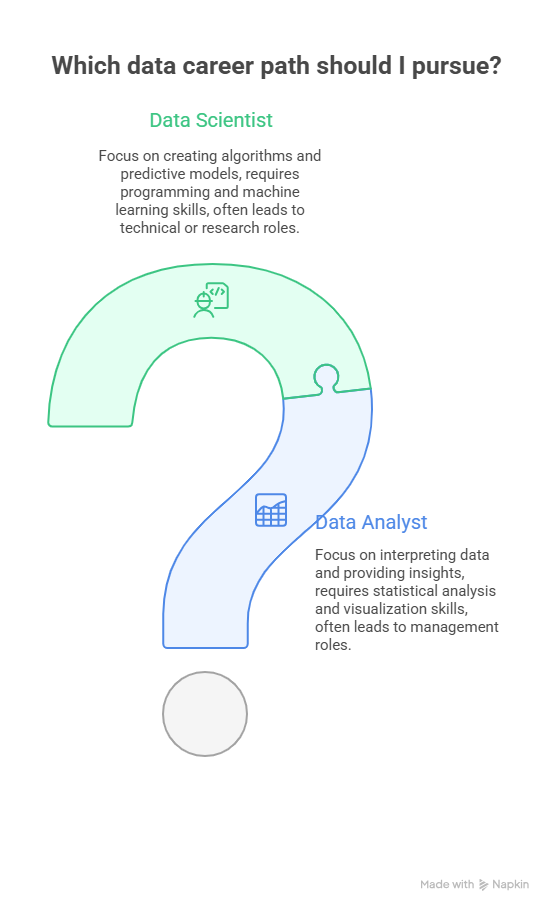
Top 5 Key Differences: Data Analyst vs Data Scientist Careers
Data Analysts and Data Scientists both work with data but in different ways. Analysts focus on structured data and reporting, while scientists use coding and machine learning to predict trends. This guide compares their skills, tools, salaries, and career paths to help you choose the right role.
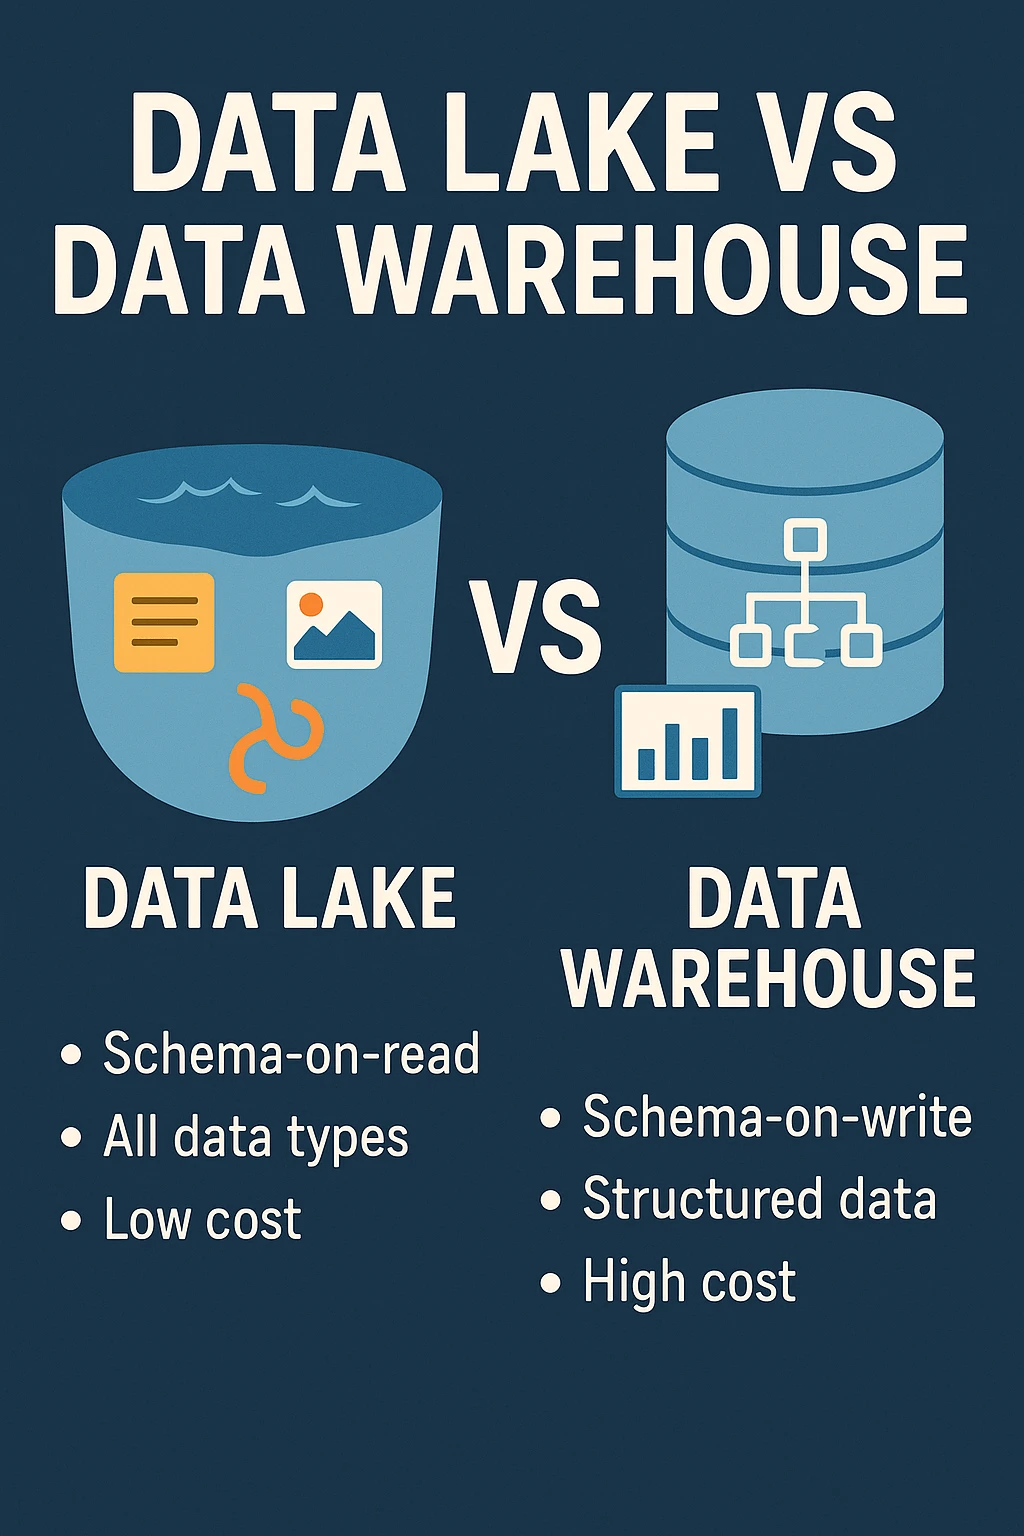
Data Lake vs Data Warehouse: Cases, and the Rise of the Lakehouse
Compare Data Lake, Data Warehouse & Lakehouse in 2025. Discover 7 powerful differences, best use cases & which model fits your data strategy.
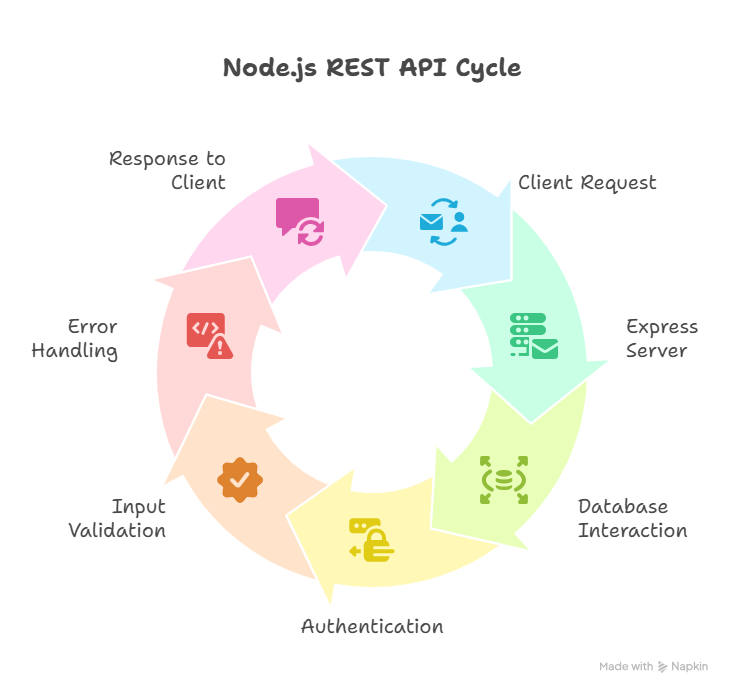
Node.js REST API: 7 Powerful Steps to Build with Express
Learn how to build a scalable RESTful API using Node.js and Express with this step-by-step beginner’s guide. Master backend development, CRUD operations, and best practices.
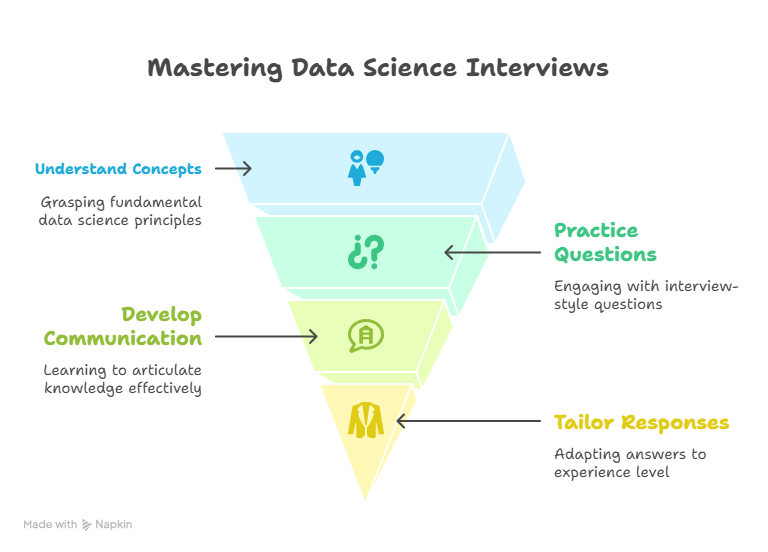
40 Data Science Interview Questions and Answers
Ace your next job interview with these 40 data science interview questions and answers—covering beginner to expert levels with practical, real-world insights.
- Data
- Development
- Design
- Career
- Artificial Inteligence
- Business

Top SQL Queries Every Data Scientist Should Know
Learn the essential SQL queries for data scientists to filter, join, group, and analyze data efficiently for better insights and faster decisions.

Top 5 Key Differences: Data Analyst vs Data Scientist Careers
Data Analysts and Data Scientists both work with data but in different ways. Analysts focus on structured data and reporting, while scientists use coding and machine learning to predict trends. This guide compares their skills, tools, salaries, and career paths to help you choose the right role.

Data Lake vs Data Warehouse: Cases, and the Rise of the Lakehouse
Compare Data Lake, Data Warehouse & Lakehouse in 2025. Discover 7 powerful differences, best use cases & which model fits your data strategy.

Node.js REST API: 7 Powerful Steps to Build with Express
Learn how to build a scalable RESTful API using Node.js and Express with this step-by-step beginner’s guide. Master backend development, CRUD operations, and best practices.
Min Read
Are you aspiring to build an exciting career that keeps you...
Min Read
Are you aspiring to build an exciting career that keeps you...
Min Read
Introduction Incremental Learning with Scikit-learn is a powerful technique that helps...
Min Read
Introduction Incremental Learning with Scikit-learn is a powerful technique that helps...
Min Read
If you’ve ever worked with HTML, CSS, and JavaScript, you’ve probably...
Min Read
If you’ve ever worked with HTML, CSS, and JavaScript, you’ve probably...
Min Read
Introduction AI automation has seen continuous growth since its launch. According...
Min Read
Introduction AI automation has seen continuous growth since its launch. According...
Min Read
Are you aspiring to build an exciting career that keeps you...
Min Read
Are you aspiring to build an exciting career that keeps you...
Min Read
Introduction Incremental Learning with Scikit-learn is a powerful technique that helps...
Min Read
Introduction Incremental Learning with Scikit-learn is a powerful technique that helps...
Min Read
If you’ve ever worked with HTML, CSS, and JavaScript, you’ve probably...
Min Read
If you’ve ever worked with HTML, CSS, and JavaScript, you’ve probably...
Min Read
Introduction AI automation has seen continuous growth since its launch. According...
Min Read
Introduction AI automation has seen continuous growth since its launch. According...
Min Read
Are you aspiring to build an exciting career that keeps you...
Min Read
Are you aspiring to build an exciting career that keeps you...
Min Read
Introduction Incremental Learning with Scikit-learn is a powerful technique that helps...
Min Read
Introduction Incremental Learning with Scikit-learn is a powerful technique that helps...
Min Read
If you’ve ever worked with HTML, CSS, and JavaScript, you’ve probably...
Min Read
If you’ve ever worked with HTML, CSS, and JavaScript, you’ve probably...
Min Read
Introduction AI automation has seen continuous growth since its launch. According...
Min Read
Introduction AI automation has seen continuous growth since its launch. According...
Min Read
In today’s hyper-connected world, businesses and developers face one big challenge:...
Min Read
In today’s hyper-connected world, businesses and developers face one big challenge:...
Min Read
The emergence of Artificial Intelligence (AI) in recent years has transformed...
Min Read
The emergence of Artificial Intelligence (AI) in recent years has transformed...

